
How to estimate the cost of Microsoft 365 Defender raw data ingestion in Microsoft Sentinel
Recently a few customers asked me to estimate the increase of costs that they would see by enabling “raw data” (Advanced Hunting data) ingestion from Microsoft 365 Defender into Microsoft Sentinel.
This ingestion is highly recommended as it strenghtens the Microsoft Sentinel’s threat detection capability for customers using the services in Microsoft 365 Defender: just as a first evidence, at the time of this writing, there are more than 40 Analytic Rule templates in Sentinel that leverage the raw data coming from Microsoft 365 Defender. Additionally, this ingestion enables access to this data for a much longer period than the 30 days available in Microsoft 365 Defender Advanced Hunting.
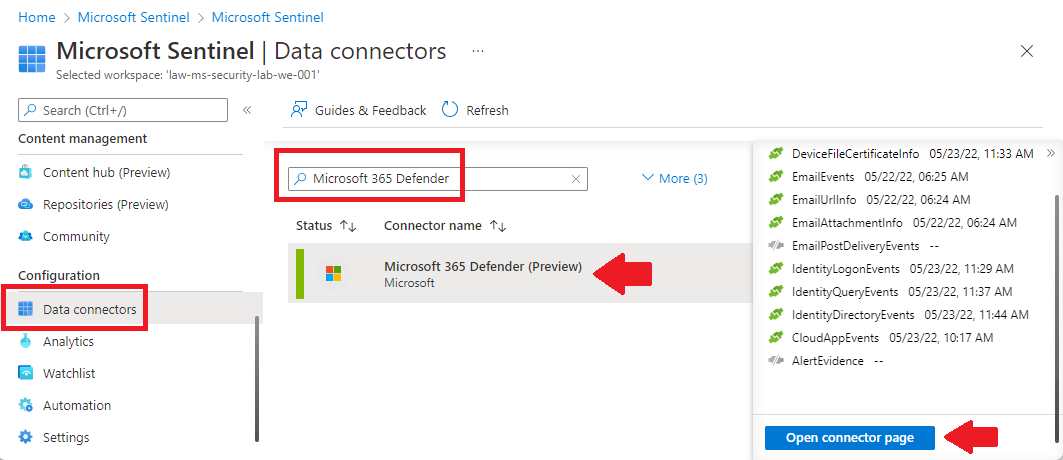
This data ingestion can be configured by activating the “Microsoft 365 Defender” data connector in Sentinel.
The increment of Sentinel costs due to this additional ingestion is strongly reduced, if not completely zeroed, by the Microsoft Sentinel benefit for Microsoft 365 E5, A5, F5, and G5 customers: at the time of this writing, customers get a data grant of up to 5 MB per user per day of Microsoft 365 data ingestion into Microsoft Sentinel. Please refer to the linked page to read the details of the licenses and tables included in the benefit.
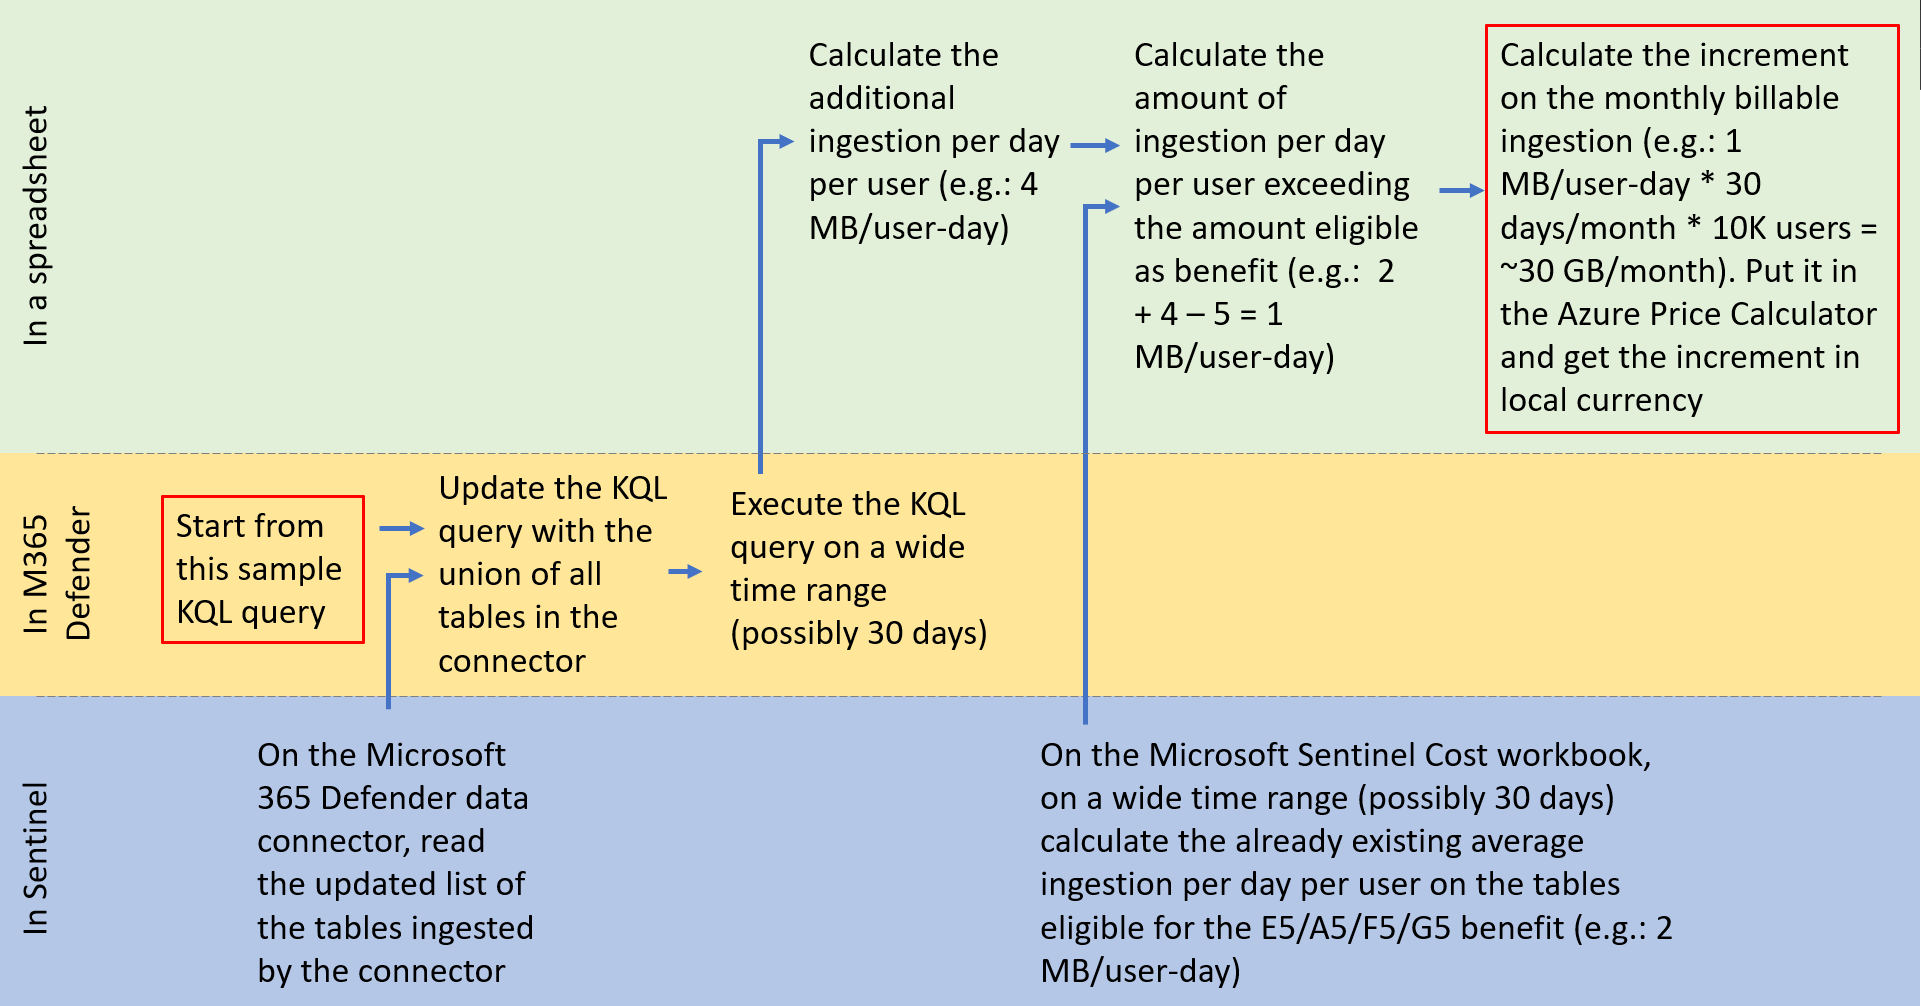
To estimate the increment of Sentinel costs, I recommend doing the list of actions described in this flowchart:
The code referenced in the first step of the flowchart is the following:
DeviceInfo
| union DeviceNetworkInfo
| union DeviceProcessEvents
| union DeviceNetworkInfo
| union DeviceFileEvents
| union DeviceRegistryEvents
| union DeviceLogonEvents
| union DeviceImageLoadEvents
| union DeviceEvents
| union DeviceFileCertificateInfo
| union EmailEvents
| union EmailUrlInfo
| union EmailAttachmentInfo
| union EmailPostDeliveryEvents
| union CloudAppEvents
| union IdentityLogonEvents
| union IdentityQueryEvents
| union IdentityDirectoryEvents
| union AlertEvidence
| summarize RecordCount = count(), TotalSizeMB = round(sum(estimate_data_size(*))/pow(1024,2),2)
As second action in the flowchart, I recommend updating the code shown above with the possible Advanced Hunting tables that have been added to the “Microsoft 365 Defender” data connector in Sentinel. This list does not change frequently but changes may happen. Just as an example, at the time of this writing we expect to have soon in Sentinel also the new “UrlClickEvents” table that was very recently added in Microsoft 365 Defender Advanced Hunting.
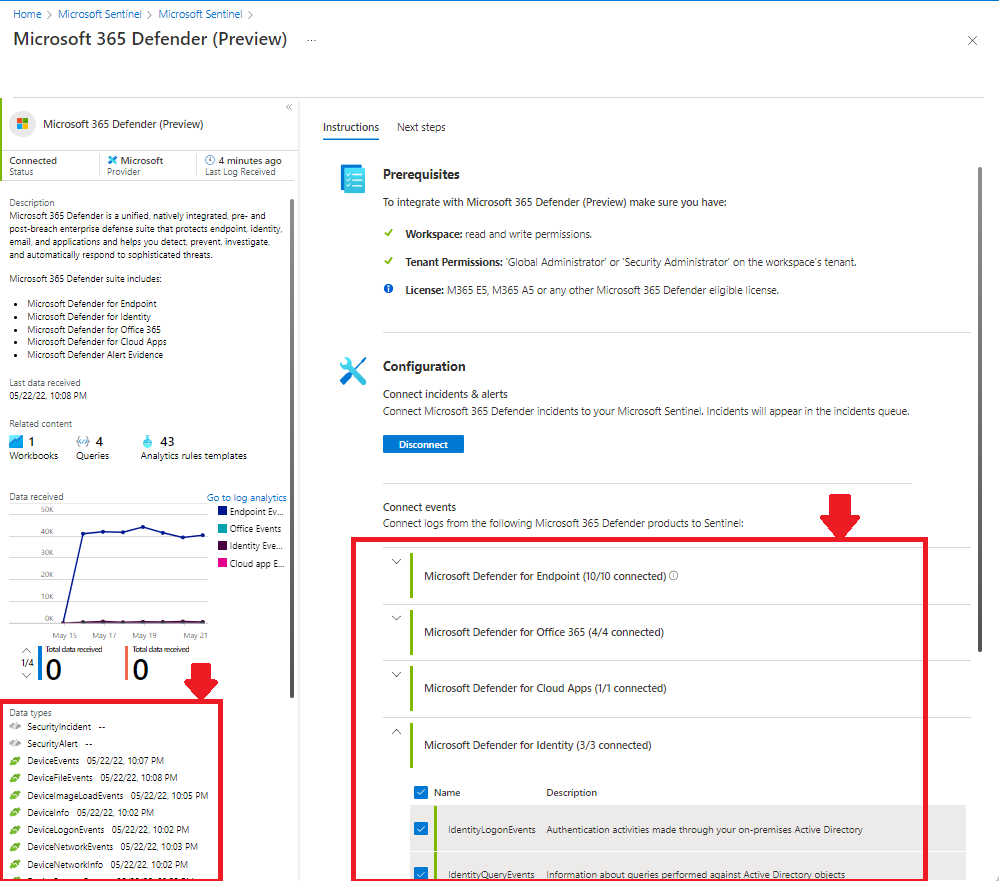
The updated list of the Microsoft 365 Defender Advanced Hunting tables that are ingested in Sentinel can be retreived in the “data connector page”:
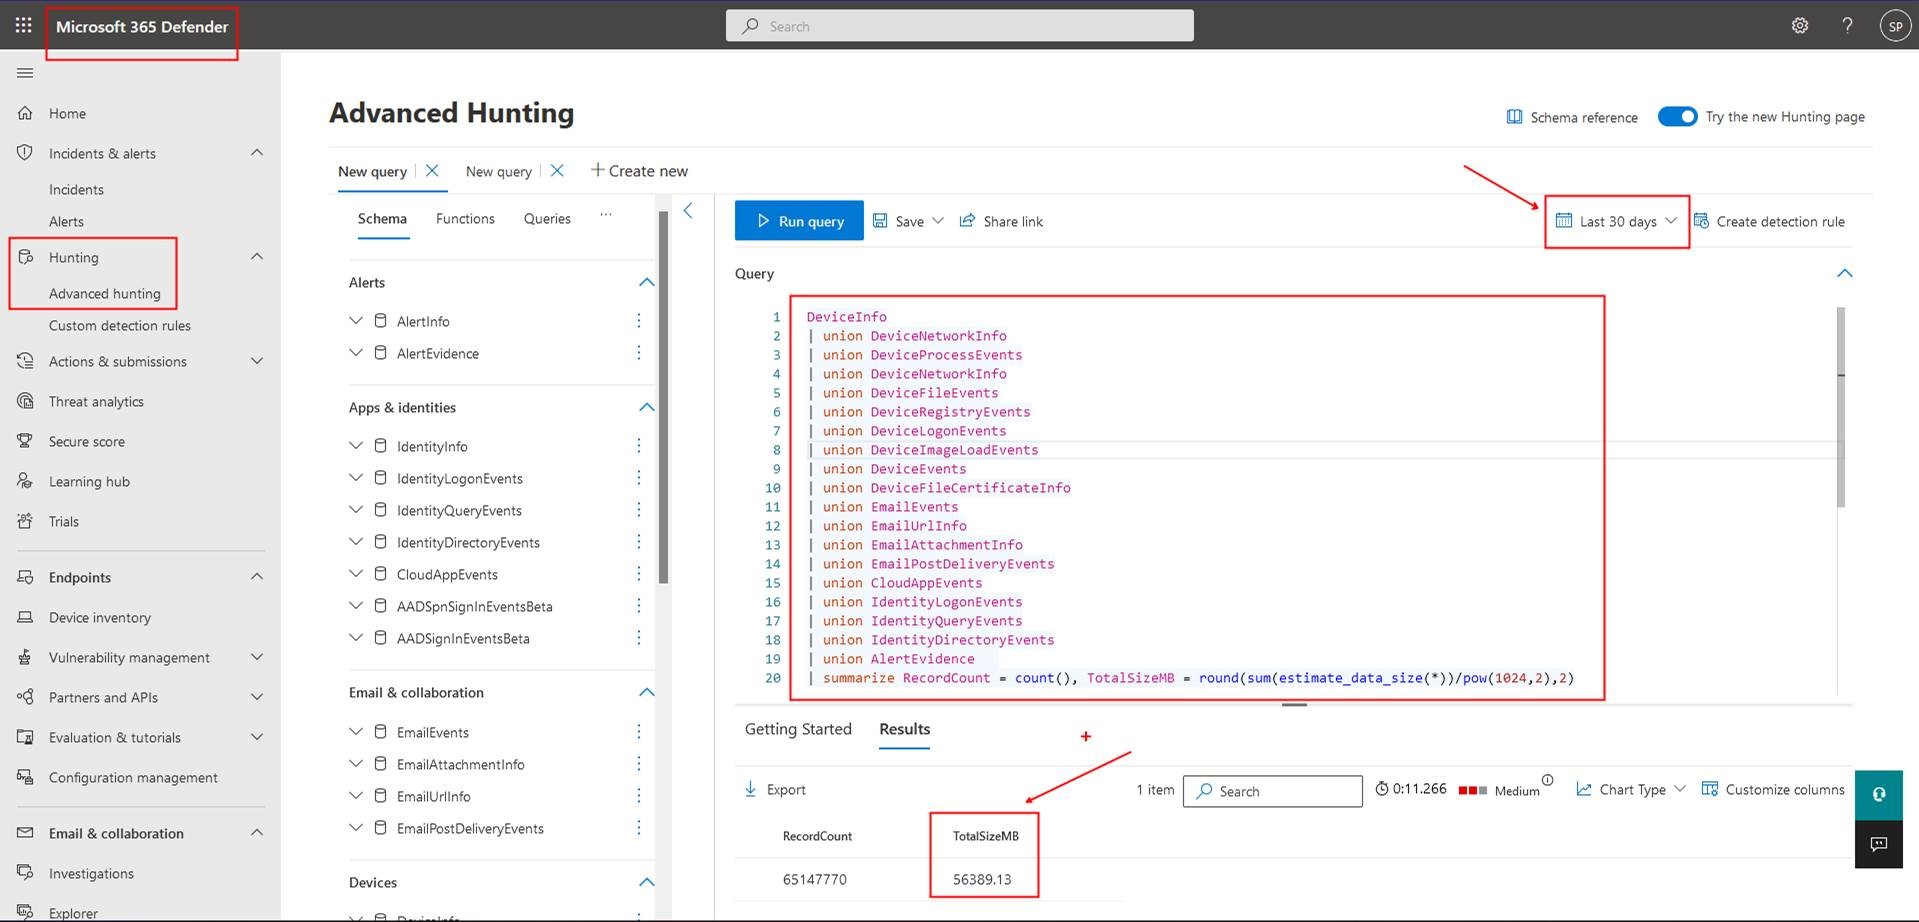
I recommend running the above query on a wide time range (e.g., 30 days):
Please note that, in the query shown above, I’m explicitly listing all the Advanced Hunting tables to be included in the union instead of using “union withsource=MDTables” because this last “one row” KQL statement returns a list of tables which does not coincide completely with the tables that are ingested in Sentinel. The list of tables returned by “union withsource=MDTables” can be retrieved with the following simple query:
union withsource=MDTables*
| distinct MDTables
Finally, in my flowchart I recommend using the “Microsoft Sentinel Cost” workbook to get the total number of the already existing ingestion on the tables that are eligible for the Microsoft 365 E5, A5, F5, and G5 benefit.
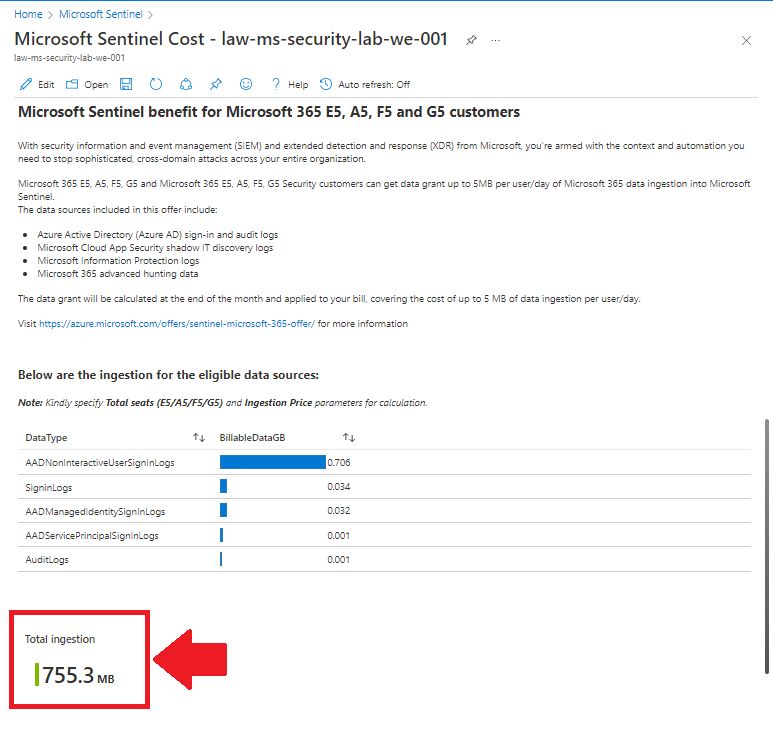
Once again, I recommend setting the “TimeRange” parameter in the workbook to a wide time interval (e.g. 30 days).
With the result of the KQL query, the evidence of the workbook and some math, you can do a simple calculation to retrieve how many MB per user per day you are going to ingest, after the activation of the “Microsoft 365 Defender” data connector in Sentinel, on the Sentinel tables that are eligible for the Microsoft 365 E5, A5, F5, and G5 benefit. The amount that possibly exceeds the 5 MB per user per day is the increase of billable ingestion.
In the flowchart I’m showing this example:
- The Microsoft 365 Defender Advanced Hunting tables would cause an increase in ingestion of 4 MB per user per day (read from the kql query)
- In Azure Log Analytics/Microsoft Sentinel, you are already ingesting 2 MB per user per day on the tables relevant for the benefit (read from the workbook)
- The amount of ingestion that will cause an increase in the Sentinel costs is (4 + 2) - 5 = 1 MB per user per day (5 MB per user per day is the current value of the benefit)
Warning Notice:
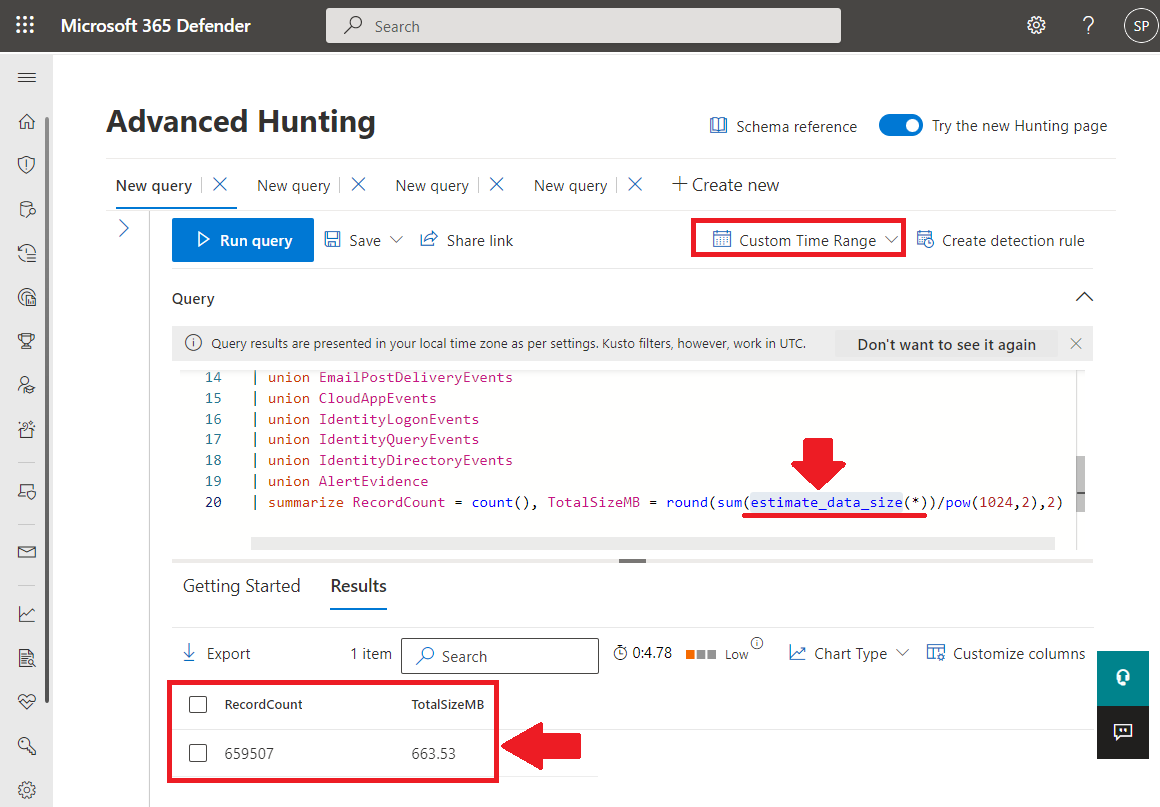
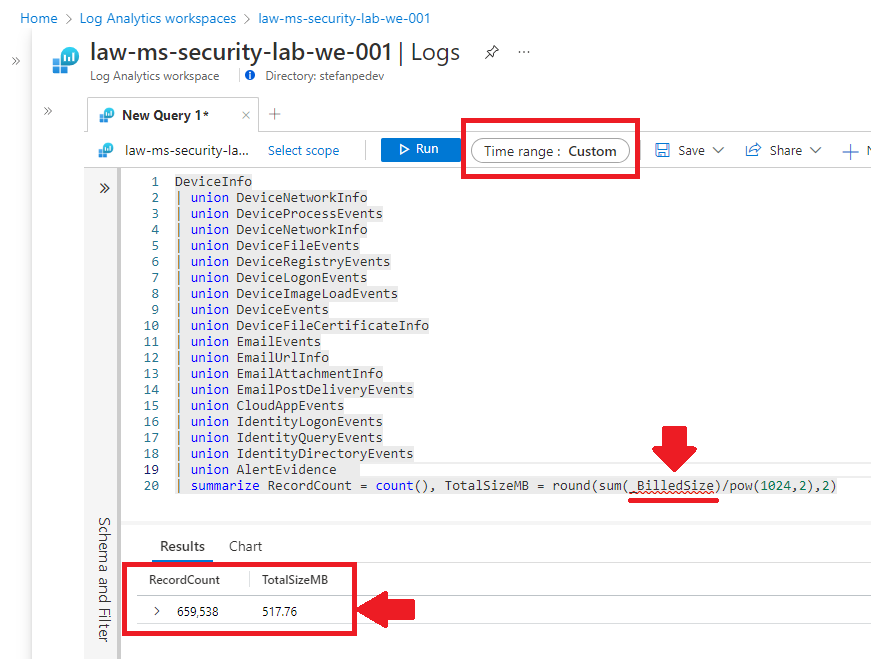
I did an “a posteriori” test, several days after activating the “Microsoft 365 Defender” connector in Sentinel with all its tables and I verified that the aforementioned KQL query to be executed in Microsoft 365 Defender (query based on the function static Kusto “estimate_data_size ()”) returns a size of about 20% -25% greater than the “billable” size that is actually found in the tables imported into Azure Log Analytics (same identical KQL query but replacing the call to the “estimate_data_size” function with the reading of the “_BilledSize” standard column available in Azure Log Analytics), while finding almost exactly the same overall number of rows.
As has just been clarified, the estimate of the increase in volumes and, therefore, of ingestion costs (before the application of the benefit) may turn out to be approximately one quarter worse than the reality. For more accurate results it is recommended to reduce the volumes calculated with the KQL query shown above by 20%.
Example of results in Microsoft 365 Defender with a custom time range of 14 days:
Example of results in Azure Log Analytics with the same exact time range:
As always, I hope that the information provided in this post may be useful.
PS. I recommend checking also the article written on the same topic by Rob Trent: Estimating the Size of the M365 Advanced Tables for Microsoft Sentinel Enablement
PPS. Feedback on this blog post can be added in this related LinkedIn post